3  Meteorological data

SWAPtools enables the download of historical meteorological data from either KNMI or OPEN-METEO.

3.1 meteorological data from KNMI

The retrieved variables (radiation, temperature, relative humidity, wind speed, precipitation, and precipitation duration) are automatically converted into the required format. The R script is managed via a control file, see Tip 3.1 (source: KNMI).

Tip 3.1: Example of input file control_meteo.inp; source: KNMI.
# Controlfile: KNMI (https://daggegevens.knmi.nl/klimatologie/daggegevens)
# Author:      H.M. Mulder
# Model:       https://swap.wur.nl
# Company:     Wageningen Environmental Research
#________________________________________________
#

DIROUT                ./KNMI                     # Path to output directory 

TSTART                2002-01-01                 # Start of period
TEND                  2002-12-31                 # End of period
TOPT                  day                        # Time interval, options are: 'day' or 'hour'; default: 'day'

STATION               HUPSEL                     # List of weather stations (separated by comma)
REPLACE               DE BILT                    # List of weather stations to replace missing values (separated by comma)

DAYTIME_WINDSPEED     Yes                        # Determine daytime averaged windspeed (7:00 - 19:00); default: Yes
#FWIND                 1.04                      # Windfactor to convert 24h to 7-19h windspeed (only if DAYTIME_WINSPEED is set to 'No')

AVERAGE_HUMIDITY      No                         # Determine actual vapour pressure based on average relative humidity, default: 'No'
#FHUM                  1.04                      # Humidityfactor (only if AVERAGE_HUMIDITY is set to 'Yes')

SPLIT                 No                         # Should weather files be split into yearly files (default: 'No')?

ANALYSE               No                         # Analyse availability meteorological conditions (default: 'No')
WIDTH                 10.0                       # Width of figure (only if ANALYSE is set to 'Yes')
HEIGHT                16.0                       # Height of figure (only if ANALYSE is set to 'Yes')

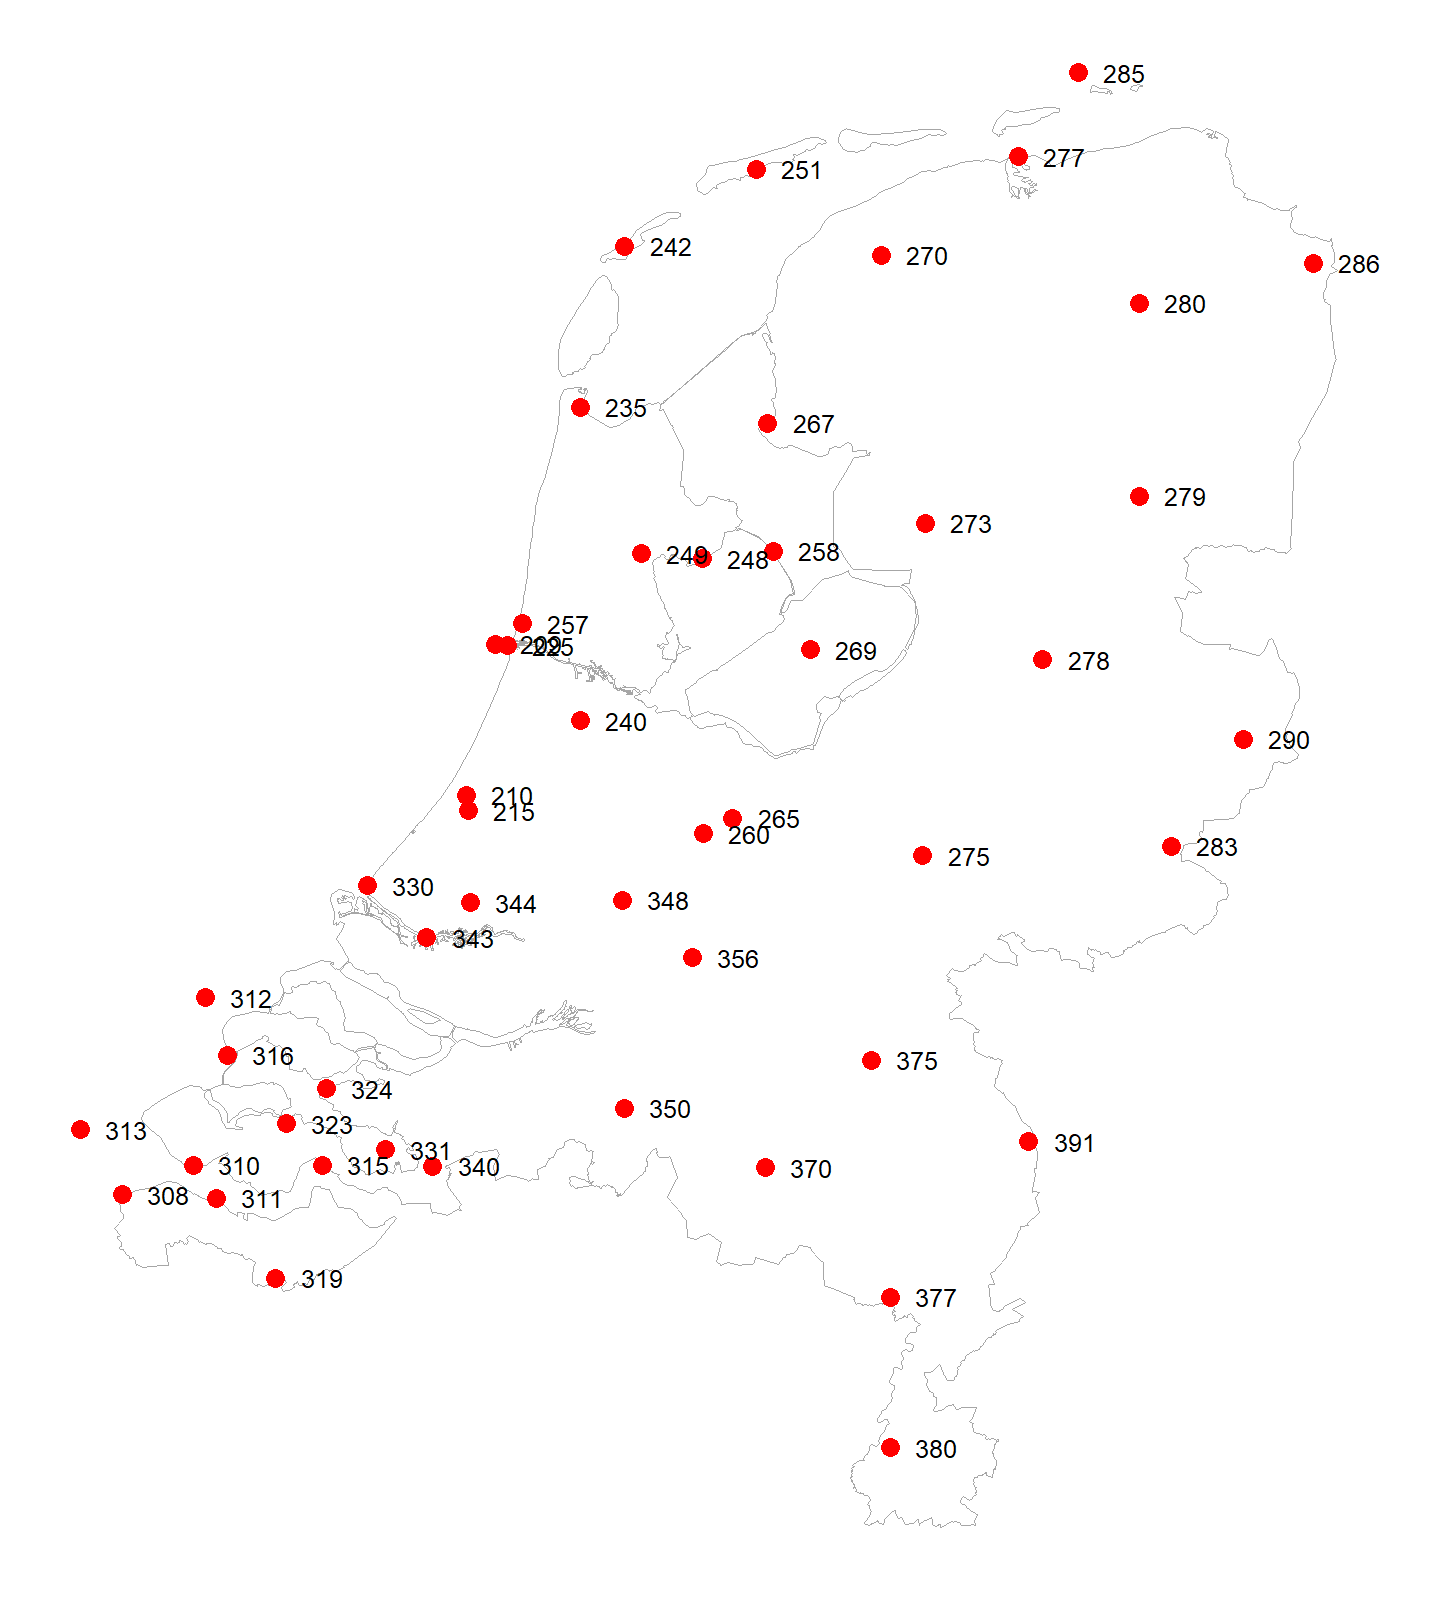
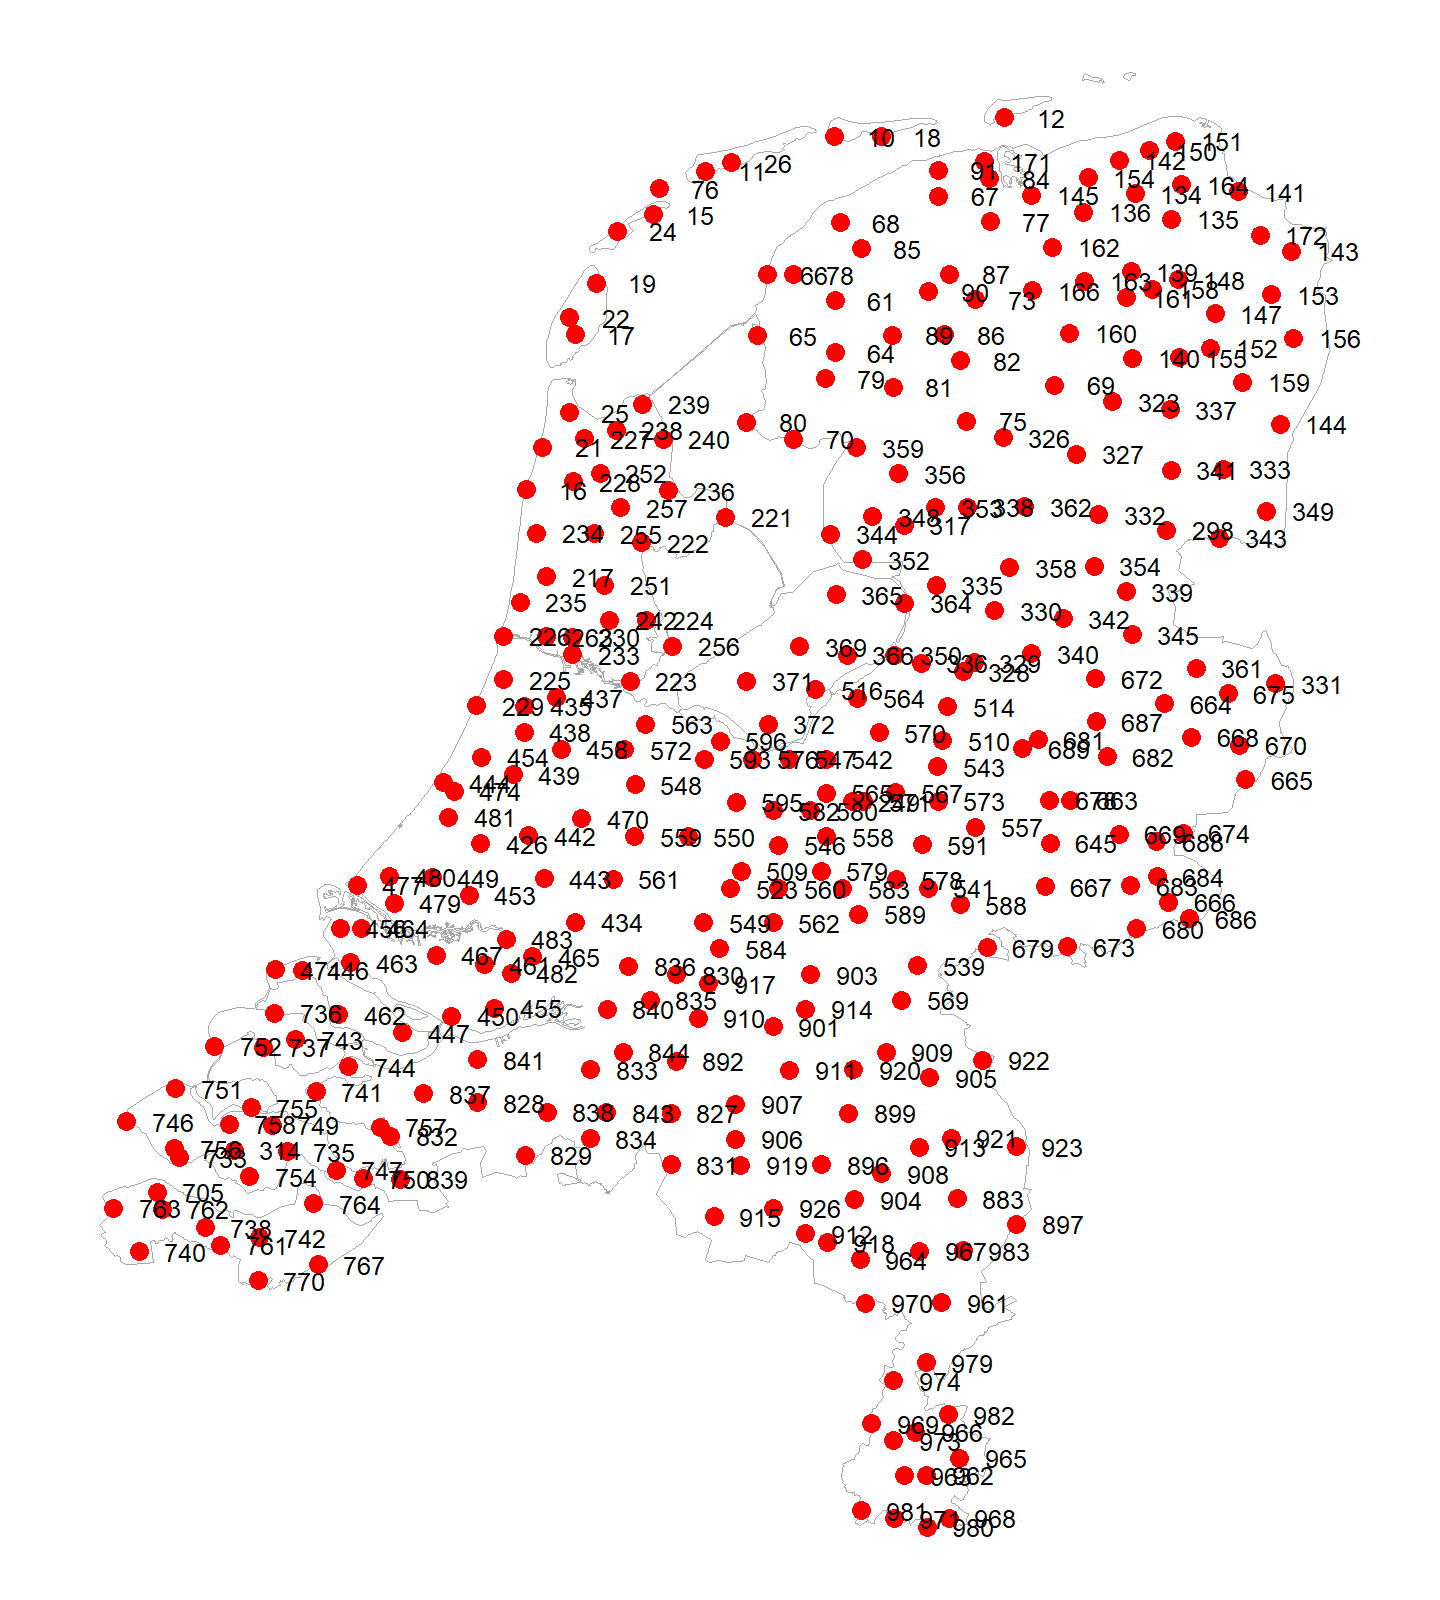
The time period can be defined using TSTART and TEND, while the weather station is selected with STATION. In cases where measurement data are missing, REPLACE can be used to designate an alternative weather station to fill these gaps (see the locations of the KNMI weather stations in Figure 3.1).

(a) Weather stations
(b) Precipitation stations
Figure 3.1: Locations of KNMI stations.

By default, daytime windspeed (7:00-19:00) is calculated from hourly data. This can be disabled by setting DAYTIME_WINDSPEED to No. In that case, the user should consider specifying a wind factor using FWIND.

The actual vapour pressure is, by default, derived from the minimum and maximum relative humidity. This can be disabled by setting AVERAGE_HUMIDITY to No, which may lead to an underestimation of atmospheric water demand. A humidity factor (FHUM) can be used to compensate for this effect.

An overview of the retrieved data can be generated by setting ANALYSE to Yes.

Optionally, precipitation data from a weather station can be replaced with more detailed data, such as hourly observations from the weather station, or with data from a precipitation station (measured over the period 08:00–08:00), see Tip 3.2. These options should be applied with caution. In the latter case, for example, precipitation duration is not available, which means the approach used to simulate interception evaporation needs to be adjusted.

Tip 3.2: Example of input file control_precipitation.inp; source: KNMI.
# Controlfile: KNMI (https://daggegevens.knmi.nl/klimatologie/daggegevens)
# Author:      H.M. Mulder
# Model:       https://swap.wur.nl
# Company:     Wageningen Environmental Research
#________________________________________________
#

DIROUT                ./KNMI                     # Path to output directory 

TSTART                2002-01-01                 # Start of period
TEND                  2002-12-31                 # End of period
TOPT                  hour                       # Time interval, options are: 'day' or 'hour'; default: 'day'

STATION               HUPSEL                     # List of weather/precipitation stations (separated by comma)
REPLACE               DE-BILT                    # List of weather/precipitation stations to replace missing values (separated by comma)

SPLIT                 No                         # Should weather files be split into yearly files (default: 'No')?

3.2 meteorological data from OPEN-METEO

SWAPtools uses a free API to retrieve data. As a result, there are limits on the amount of data that can be downloaded. For more information, see the OPEN-METEO website.

The control file shown below works similarly to KNMI. Instead of selecting a weather station, the user should now specify a location using LATITUDE and LONGITUDE. Only the download of daily weather data is currently supported.

Tip 3.3: Example of input file control_meteo.inp; source: OPEN-METEO.
# Controlfile: OPEN-METEO (https://open-meteo.com)
# Author:      H.M. Mulder
# Model:       https://swap.wur.nl
# Company:     Wageningen Environmental Research
#________________________________________________
#

DIROUT                ./OPEN-METEO               # Path to output directory 

TSTART                2002-01-01                 # Start of period
TEND                  2002-12-31                 # End of period
TOPT                  hour                       # Time interval, options are: 'day' or 'hour'; default: 'day'

LATITUDE              52.1                       # Latitude of location
LONGITUDE             5.18                       # Longitude of location

SPLIT                 No                         # Should weather files be split into yearly files (default: 'No')?

ANALYSE               No                         # Analyse availability meteorological conditions (default: 'No')
WIDTH                 10.0                       # Width of figure (only if ANALYSE is set to 'Yes')
HEIGHT                16.0                       # Height of figure (only if ANALYSE is set to 'Yes')